About Me

Hello, Quzeem Olamide here. I'm a Data & BI Analyst focused on turning
business data into reliable dashboards, actionable insights, and scalable
reporting solutions. My work sits at the intersection of data analysis,
business intelligence, and reporting automation.
I work primarily with Power BI, SQL, Microsoft Excel, DAX,
Power Query, and Power Pivot to transform data into meaningful
business insights. I also have hands-on experience with Microsoft
Fabric and modern analytics workflows, with a focus on building
solutions that are practical, maintainable, and useful to
decision-makers.
Beyond building analytical solutions, I actively share my knowledge
through technical sessions, webinars, tutorials, and articles
covering Power BI, Excel, and business intelligence. I enjoy
breaking down technical concepts and showing how they can be
applied to real reporting and analytical problems.
I am a 3× Microsoft Certified professional, holding certifications
in Power BI and Microsoft Fabric, and a graduate of the University
of Lagos with a degree in Mathematics and Education.
BI in Excel:
Automated Dashboards with
Power Query & Power Pivot
Tools: Microsoft Excel • Power Query • Power Pivot • DAX
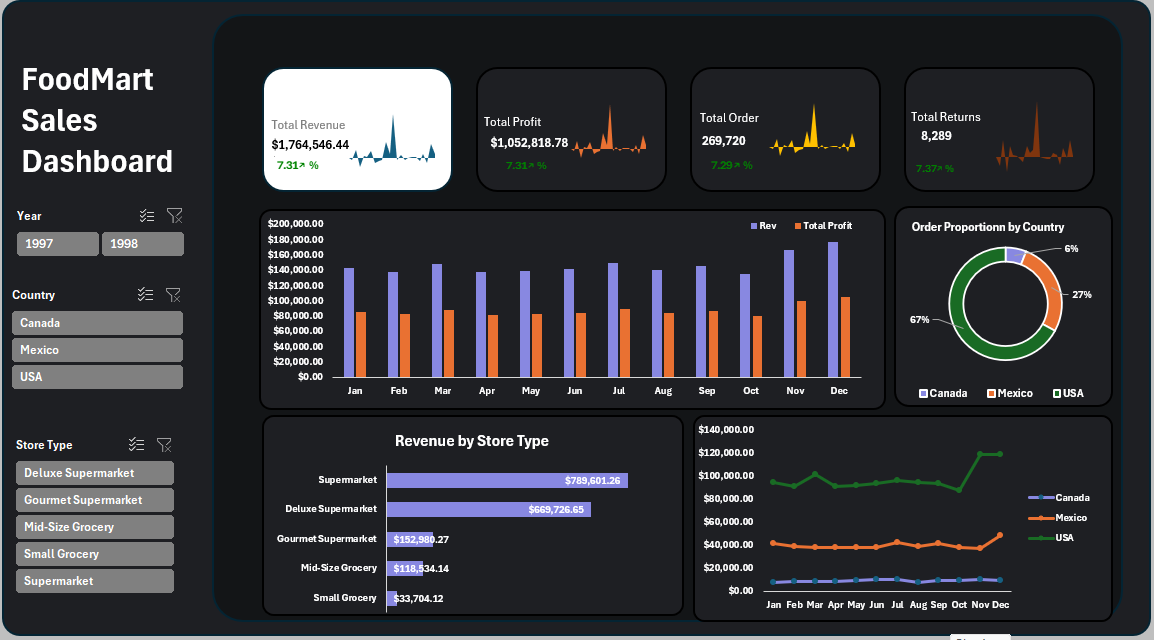
Built an automated business intelligence workflow in Excel using Power Query and Power Pivot. The project demonstrates how organizations with budget or licensing constraints can leverage existing Excel capabilities to build automated, scalable, and interactive reporting solutions without requiring Power BI.
Sales Performance &
Growth Analytics
Tools: Power BI • DAX • Data Modeling • RLS
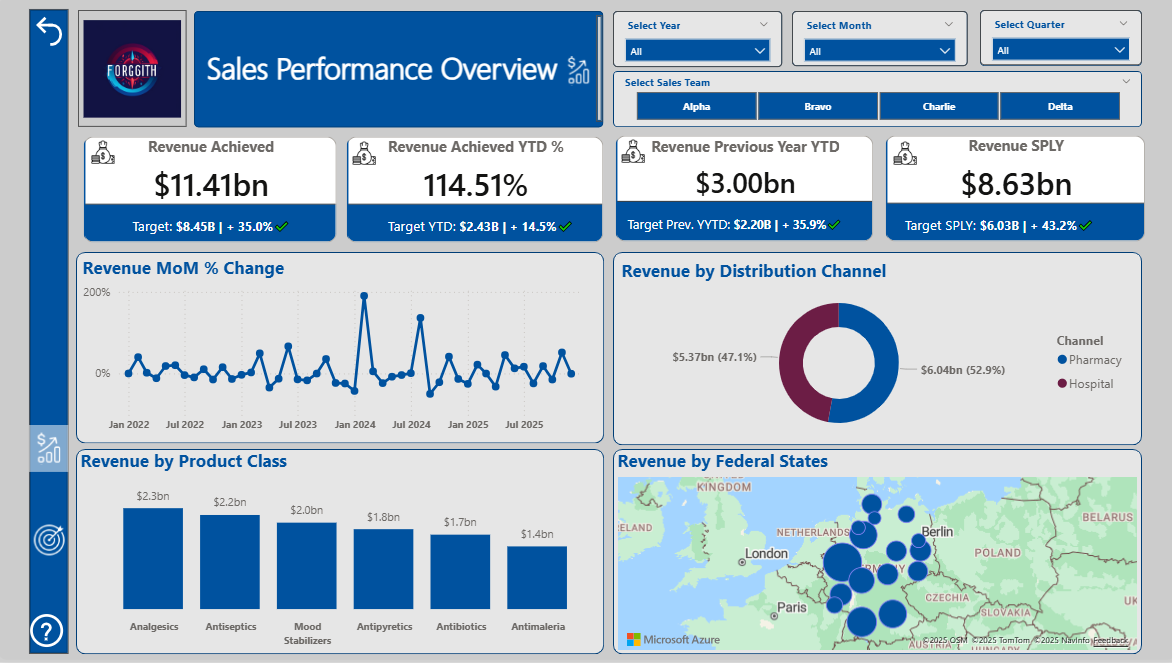
Built a Power BI solution using 213K+ distributor and product-level records to analyze revenue trends, distributor concentration, and sales performance. The dashboard incorporates data modeling, DAX, and Row-Level Security to provide role-based access for Sales Representatives, Managers, and Executives.
Pizza Runner:
Operational Performance &
Customer Order Analysis
Tools: SQL • Power BI • Operational Analytics
Conducted end-to-end SQL analysis across 6 interrelated tables to evaluate customer order preferences, delivery metrics, and runner performance using CTEs, joins, and window functions in a simulated pizza delivery platform. Designed a Power BI dashboard to communicate operational overview, customer preferences, and runner performance, enabling stakeholder-driven operational decisions.
Kiva Loan:
Data Management &
Import Optimization
Tools: MySQL • Microsoft Excel
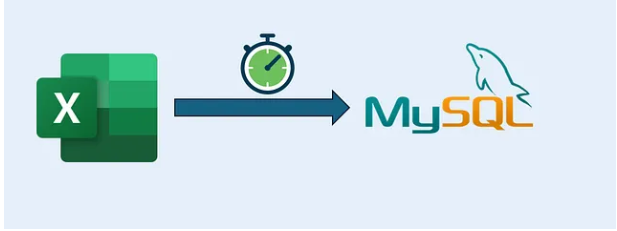
Designed and implemented a scalable MySQL schema and table structure to handle the growing volume of Kiva data. Optimized the data import workflow to transfer over 670K rows from Excel to MySQL Workbench in under a minute while ensuring zero data loss.
Tools: Python • Pandas • NumPy • Matplotlib • Seaborn

In this project I explored the variables that are pivotal in predicting a borrower's loan outcome using Python. The project consists of two parts: a data exploration component involving univariate, bivariate, and multivariate analysis using NumPy, Pandas, Seaborn, and Matplotlib, and a presentation communicating the data findings.
Tools: SQL • MySQL • CTEs • Window Functions
My solution to Danny Ma's 8 Weeks SQL Challenge, Case Study 1. The solution incorporates aggregate functions, window functions, joins, and Common Table Expressions with an emphasis on readability.
Tools: R • Data Analysis • Data Visualization

My first project in Data Analytics. This data exploration project generated insights to support marketing strategies aimed at converting casual riders into annual members using R programming language.
Tools: Python • Pandas • NumPy • Matplotlib

My first data analysis project using Python. In this project I explored the factors that may influence whether patients show up for or default on scheduled appointments at a hospital in Brazil.
BI in Excel:
Automated Dashboards with
Power Query & Power Pivot
.jpg)
In this session, I demonstrate how to build an automated business intelligence workflow in Excel using Power Query and Power Pivot. I walk through data transformation, data modeling, DAX, calculated columns, and a calendar table to create a Power BI-inspired reporting solution in Excel.
Dynamic Reporting with
Field Parameters &
Calculation Groups
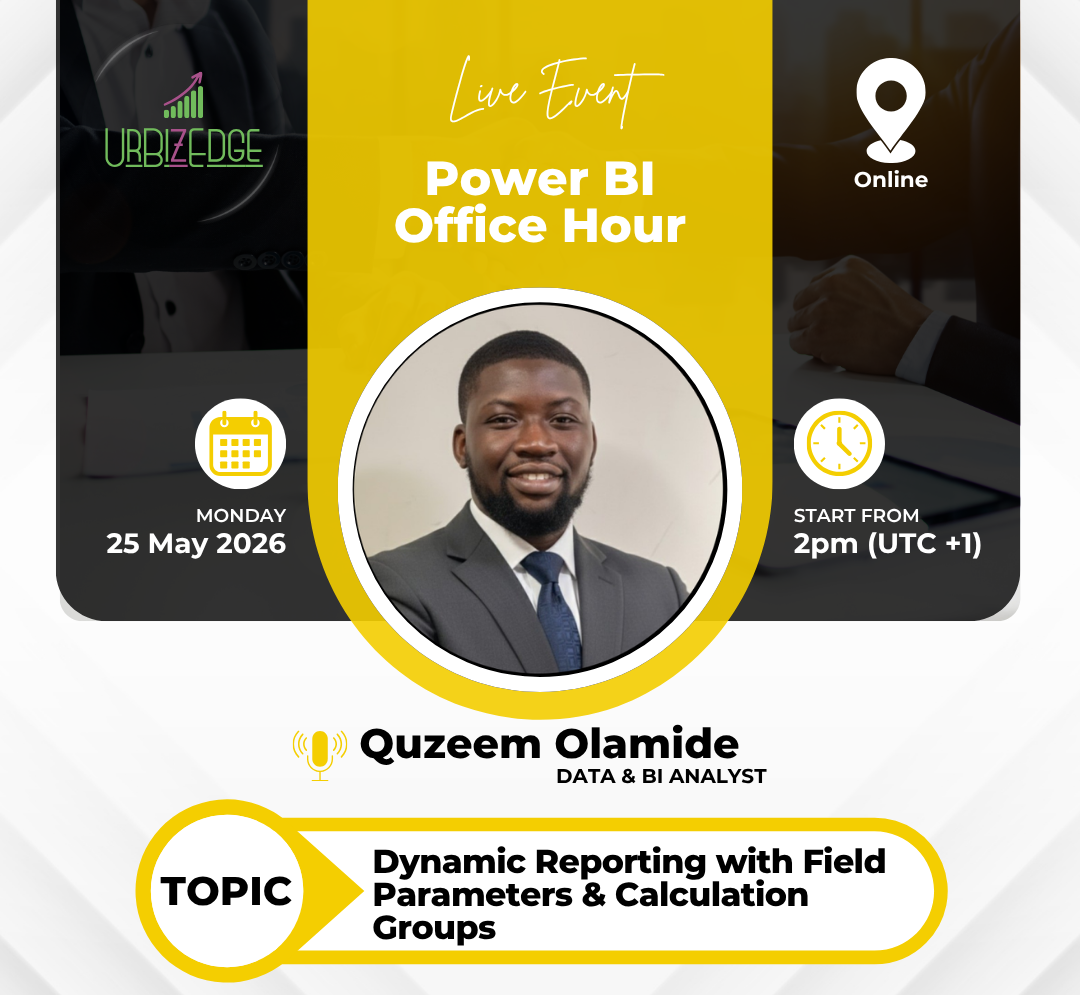
In this session, I demonstrate how to use Field Parameters to let users dynamically switch metrics and dimensions, and how Calculation Groups can centralize time-intelligence logic using SELECTEDMEASURE(). I also show how both features can work together to build more flexible, self-service Power BI reports.
Beyond Power BI Desktop:
A Beginner's Guide to
Power BI Service
.png)
In this session, I introduce Power BI Service and demonstrate what happens after a report leaves Power BI Desktop, covering the key concepts beginners need to understand when working with reports and content in the Power BI Service.
Automate Excel Workflow with
Power Query & Pivot Tables
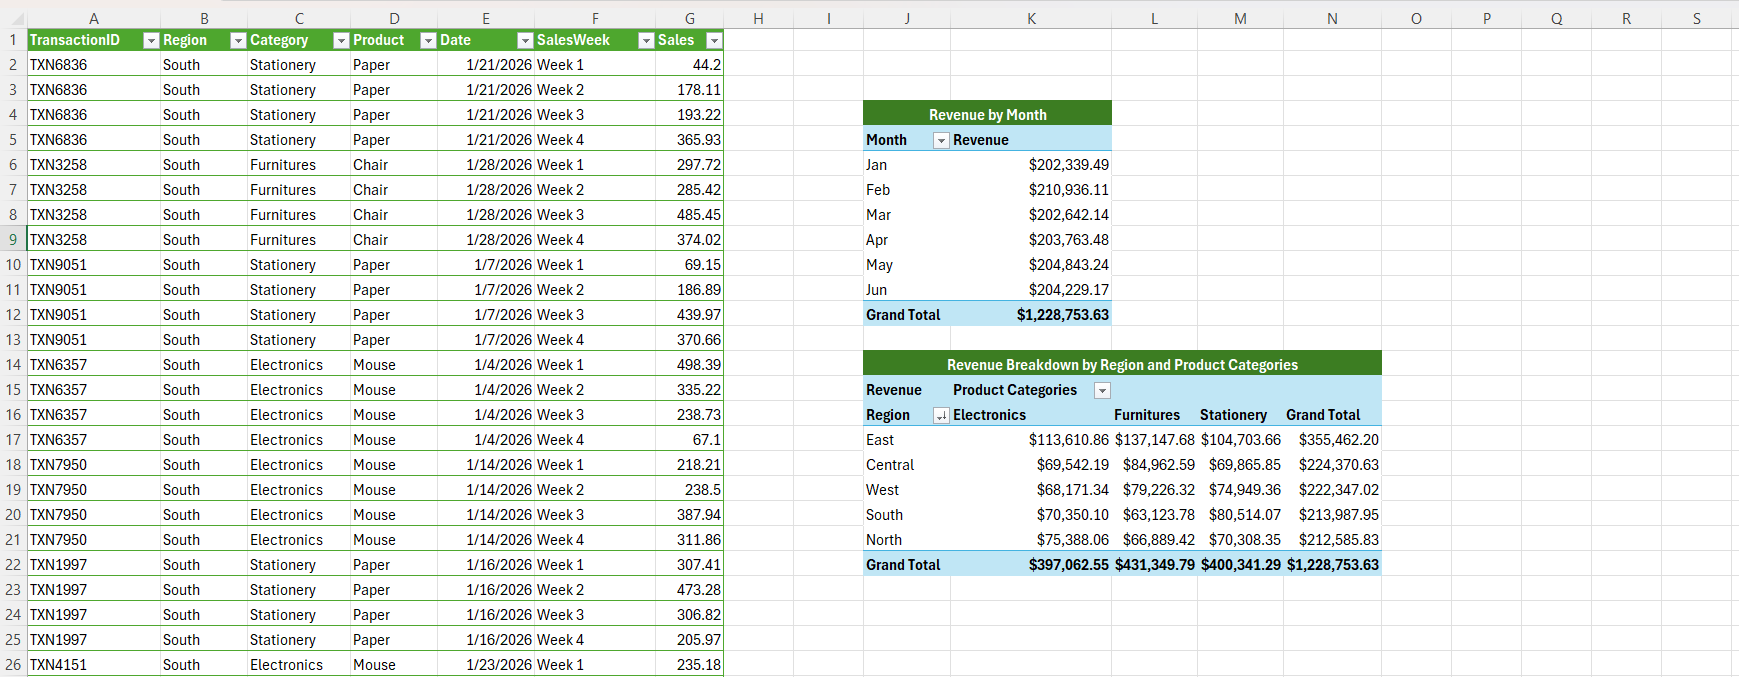
In this tutorial, I demonstrate how Power Query and Pivot Tables can be combined to automate recurring Excel reporting tasks, reduce repetitive manual work, and create a more efficient reporting workflow.
Power BI New Card Visual
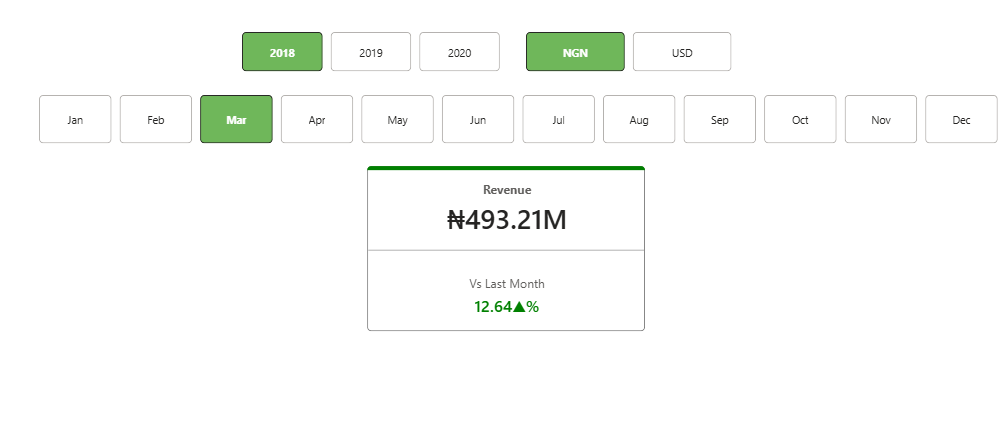
In this video, I walk through how to build a dynamic Card visual by combining its capabilities with a few DAX techniques, including reference labels to provide additional context, dynamic format strings to display performance indicators dynamically, and conditional formatting to change the card’s accent bar based on performance and dynamically change the reference label colour.
Dynamic Search with
XLOOKUP & SUMIFS

In this short tutorial, I demonstrate how XLOOKUP and SUMIFS can be combined to create a dynamic search experience in Excel, allowing users to retrieve and summarize information based on selected criteria.
Creating Running Sum
with Pivot Tables
In this short tutorial, I demonstrate how to create a running sum using an Excel Pivot Table, turning a standard summary into a cumulative view that makes trends easier to track.
Contact
Address
Lagos, Nigeria.
Phone
(+234) 812-538-876
Email
olamidequzeem91@gmail.com
Social
Elements
Text
This is bold and this is strong. This is italic and this is emphasized.
This is superscript text and this is subscript text.
This is underlined and this is code: for (;;) { ... }. Finally, this is a link.
Heading Level 2
Heading Level 3
Heading Level 4
Heading Level 5
Heading Level 6
Blockquote
Fringilla nisl. Donec accumsan interdum nisi, quis tincidunt felis sagittis eget tempus euismod. Vestibulum ante ipsum primis in faucibus vestibulum. Blandit adipiscing eu felis iaculis volutpat ac adipiscing accumsan faucibus. Vestibulum ante ipsum primis in faucibus lorem ipsum dolor sit amet nullam adipiscing eu felis.
Preformatted
i = 0;

while (!deck.isInOrder()) {
    print 'Iteration ' + i;
    deck.shuffle();
    i++;
}

print 'It took ' + i + ' iterations to sort the deck.';
Lists
Unordered
- Dolor pulvinar etiam.
- Sagittis adipiscing.
- Felis enim feugiat.
Alternate
- Dolor pulvinar etiam.
- Sagittis adipiscing.
- Felis enim feugiat.
Ordered
- Dolor pulvinar etiam.
- Etiam vel felis viverra.
- Felis enim feugiat.
- Dolor pulvinar etiam.
- Etiam vel felis lorem.
- Felis enim et feugiat.
Icons
Actions
Table
Default
| Name |
Description |
Price |
| Item One |
Ante turpis integer aliquet porttitor. |
29.99 |
| Item Two |
Vis ac commodo adipiscing arcu aliquet. |
19.99 |
| Item Three |
Morbi faucibus arcu accumsan lorem. |
29.99 |
| Item Four |
Vitae integer tempus condimentum. |
19.99 |
| Item Five |
Ante turpis integer aliquet porttitor. |
29.99 |
|
100.00 |
Alternate
| Name |
Description |
Price |
| Item One |
Ante turpis integer aliquet porttitor. |
29.99 |
| Item Two |
Vis ac commodo adipiscing arcu aliquet. |
19.99 |
| Item Three |
Morbi faucibus arcu accumsan lorem. |
29.99 |
| Item Four |
Vitae integer tempus condimentum. |
19.99 |
| Item Five |
Ante turpis integer aliquet porttitor. |
29.99 |
|
100.00 |